Visit the Pollination Mapper tool here.
Help Contents for Pollination Mapper:
—————————————————————————————————————–
FAQs
What does Pollination Mapper do?
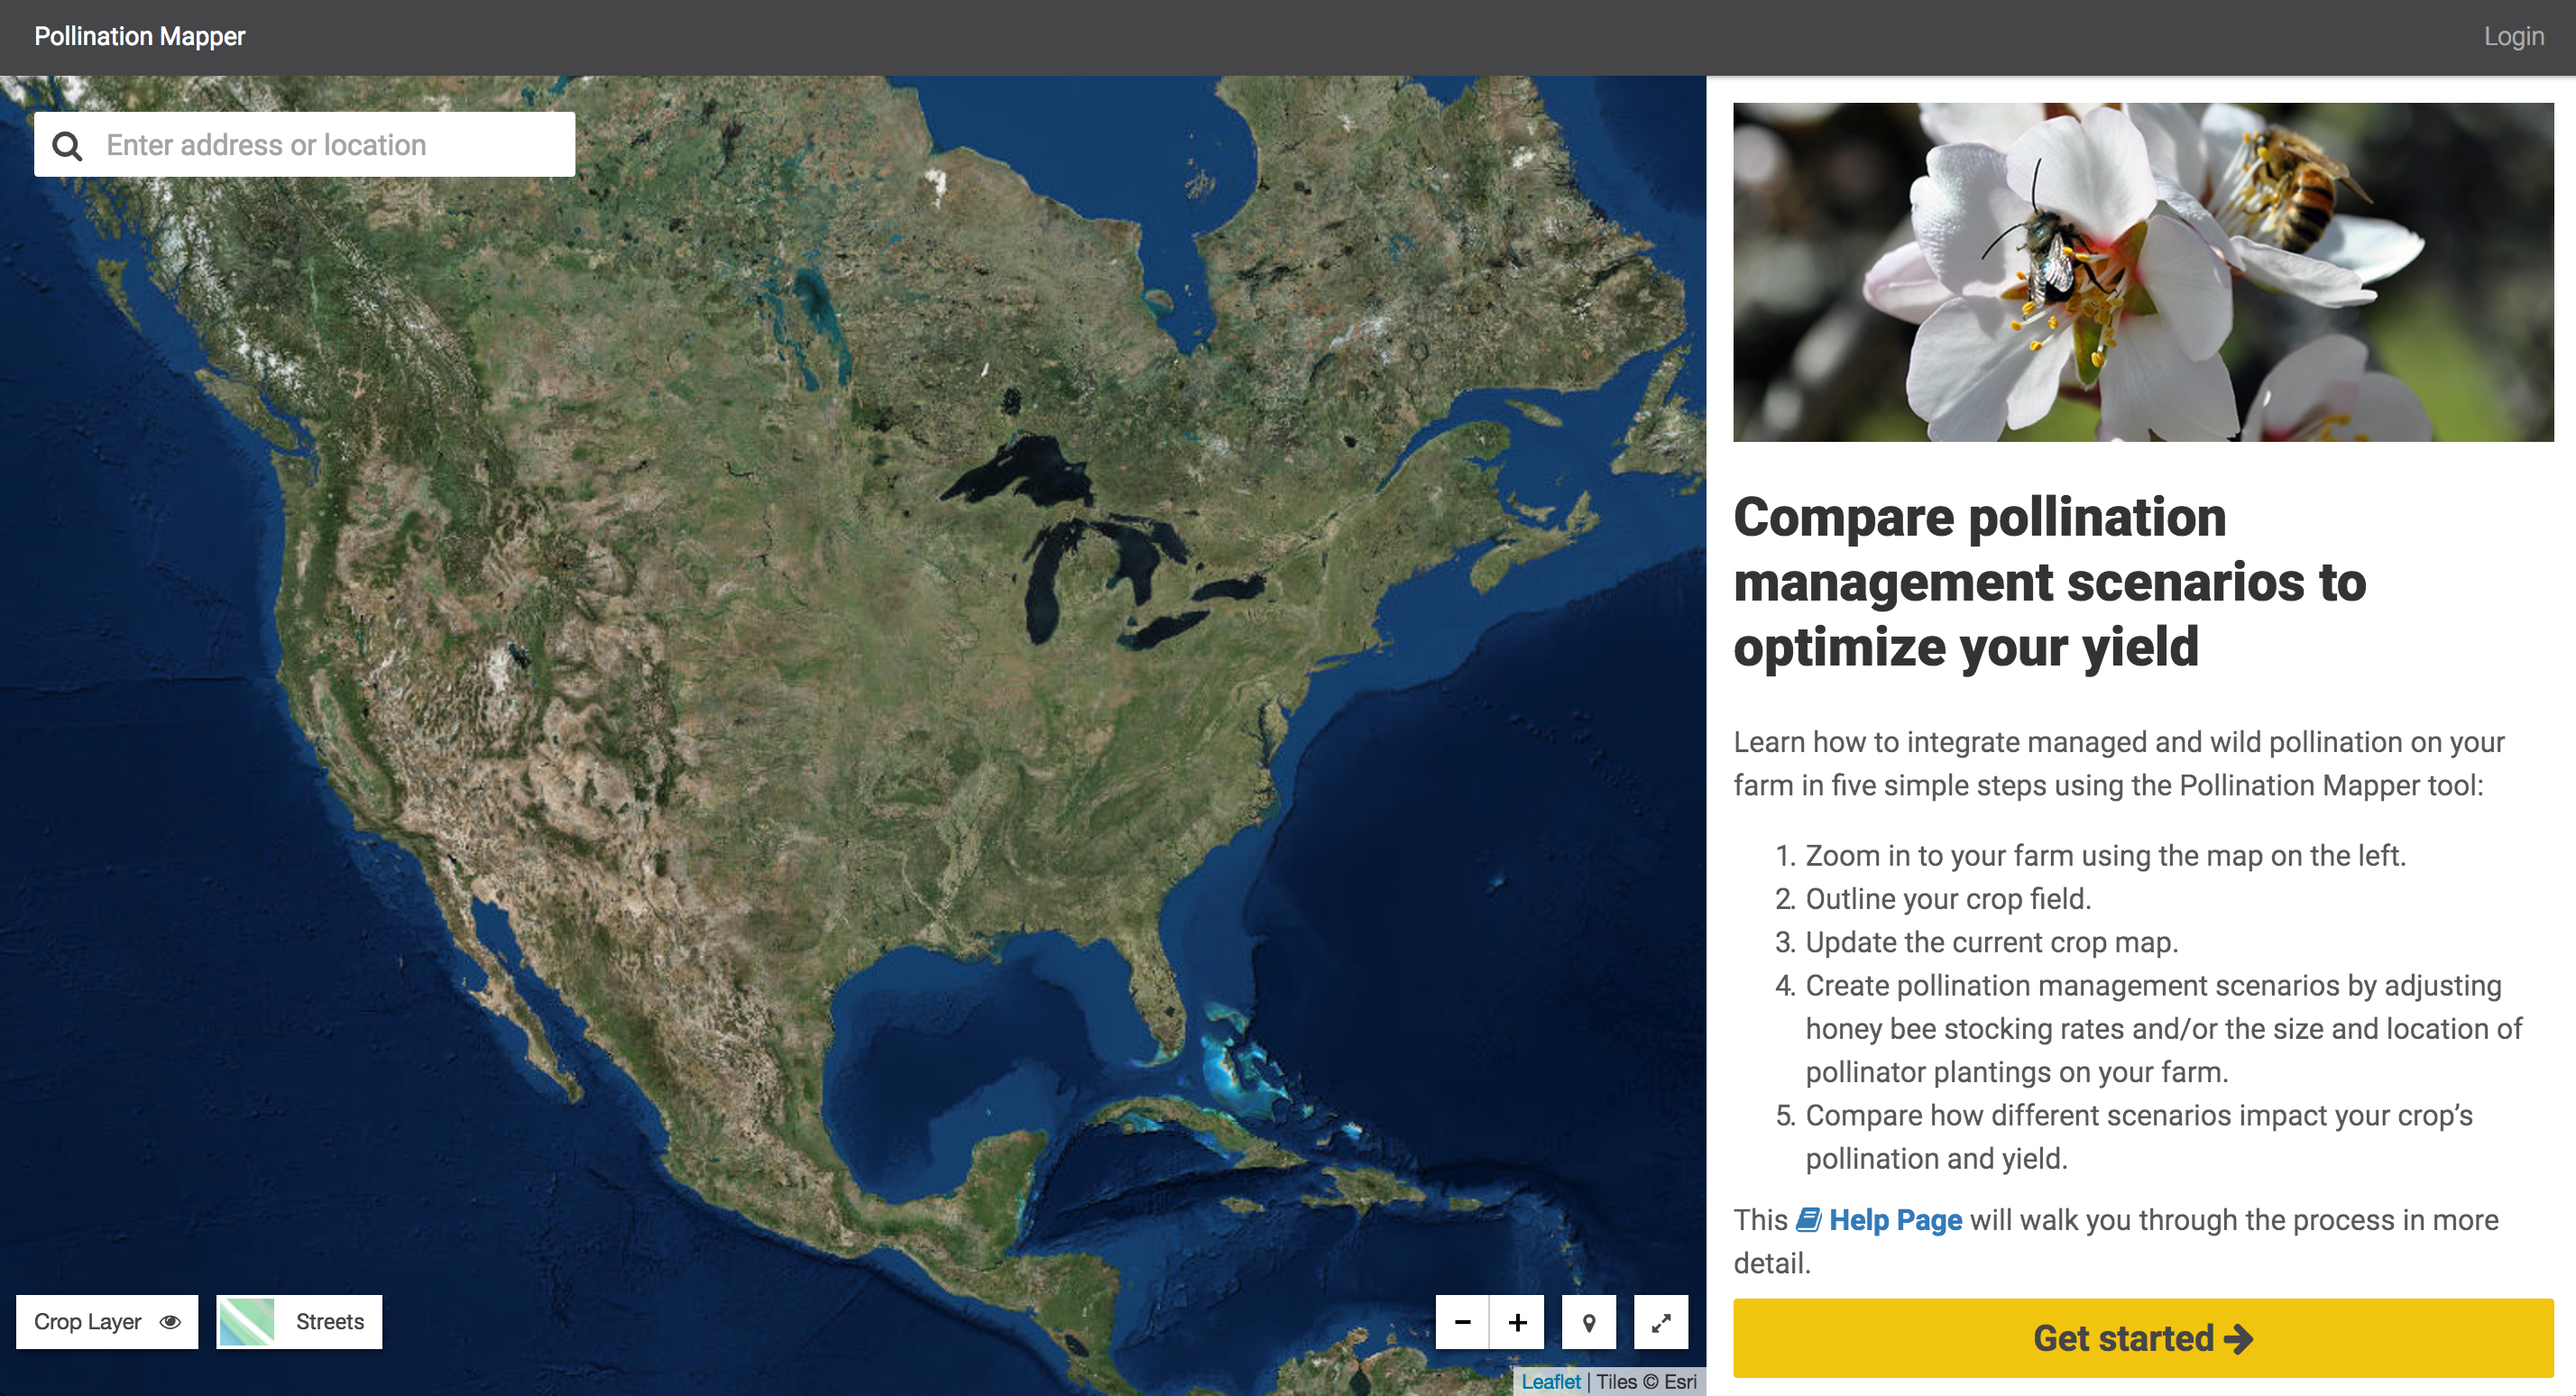
- Pollination Mapper is an on-line decision support tool to provide insight and guidance to specialty crop growers make pollination management decisions. Pollination Mapper allows growers to map out a crop field of interest on an aerial image, create different management scenarios, such as the honey bee hive stocking rate or the addition of pollinator plantings (e.g. wildflowers, hedgerows, or mix of wildflowers and hedgerows), and then compare predicted relative yield outcomes. Specifically It provides growers with insights as to the potential of landscape surrounding their crop field to provide wild bee pollination, and then evaluate how pollination management decisions interact to affect their crop’s yield.
How does Pollination Mapper work?
- This tool uses cropland data from the USDA-National Agricultural Statistics Service (NASS), crop pollination data, information about how land cover affects populations of wild and managed bees, and mathematical models to predict crop yield. The tool first predicts the number of wild bees found in the target crop field given the surrounding landscape. The tool evaluates the land within 3 km (~1.8 miles) the field of interest to score the estimated quality of the landscape for providing floral and nesting resources, or food and shelter, for wild bees. Resources closer to the field of interest (e.g. within 670m (0.41 miles) – bee’s average foraging distance) has more influence in the model than fields farther away from the field of interest. The estimates of the nesting and floral resources provided by different land cover types come from wild pollination experts surveyed for this project. The methods used are described in Koh et al. (2016). The tool uses this habitat quality information to predict the abundance of wild bees available for crop pollination. The tool combines this wild bee abundance information with honey bee stocking rate information and the pollinator dependence of the crop to predict the relative yield (e.g. % of potential maximum yield) for that crop. Honey bee stocking rates are based on recommendations from Delaplane, K.S. , Mayer, D.R., and Mayer D.F. Crop Pollination by Bees. 2000. CABI Publishing. To read about the inner workings of the model in more detail visit the pollination module of the Natural Capital Project’s Integrated Valuation of Ecosystem Services and Tradeoffs (inVEST) model here.
What crops are included in Pollination Mapper?
- The tool supports yield calculations for the pollinator dependent crops listed in the map legend. However, currently, only the following crops can be used to correct the Current Crop Map: almonds, apples, blueberries, cherries, pumpkins, raspberries, and watermelons. Therefore, the tool is most useful for growers of these crops. (Click here to see the full list of crops and how they relate to the USDA NASS Cropland Data Layer.)
Who might want to use Pollination Mapper?
- Extension agents, conservation practitioners and others who work with US specialty crop growers of almonds, apples, blueberries, cherries, pumpkins, raspberries, or watermelons can use this tool to inform pollination management recommendations. Interested specialty crop growers of almonds, apples, blueberries, cherries, pumpkins, raspberries, or watermelons can use this tool to make pollination management decisions.
How pollinator dependent is my crop according to Pollination Mapper?
- Pollination Mapper uses pollinator dependency categories based on Klein, AM, BE Vaissiere, JH Cane, I. Steffan-Dewenter, SA Cunningham, C. Kremen, and T. Tscharntke. 2007. Importance of pollinators in changing landscapes for world crops. Proceedings of the Royal Society B-Biological Sciences 274: 303-313. You can access the full scientific paper here and then look at Appendix 2 “Crop selection pathway to evaluate the levels of dependence on animal pollination for crops important in the global market” or you can download that appendix by clicking here. Note: crop varieties can differ in how dependent they are on crop pollinators.
Can I save multiple projects?
- Yes! However, you will need to create an account and log in to Pollination Mapper to save projects.
My crop doesn’t show up when I draw my farm. What should I do?
- Use the crops in the “Land Cover” drop down menu to draw in your crop field or block. Note that the tool will not accept fields smaller than 100 ft by 100 ft.
Why can’t I add crop fields or pollinator plantings smaller than 100 x 100 ft in size?
- The underlying crop data in Pollination Mapper is based on the USDA NASS Cropland Data Layer. USDA NASS generates this data by using satellite imagery, remote sensing tools, and the USGS National Landcover Database. The resolution of this is data is 30m x 30m (e.g. ~100ft x ~100ft). This means that the entire data set is made up of a grid of cells where each cell is ~100 ft x ~100 ft. Each cell then gets categorized (e.g. apple, almond, wildflower planting, etc.) based on the corresponding satellite imagery.
- When you draw a crop field or pollinator planting area using the Land Cover or Pollinator Planting tools, any individual map cell your drawing overlaps will change to the new crop or pollinator planting type you’ve specified. New modifications will overwrite the base map as well as any previous drawings they overlap.
My crop disappeared! What happened? What should I do?
- The crop was probably drawn either completely or partially over by a pollinator planting or other crop. If a drawing overlaps any part of the underlying cell or pixel, it will change what the cell represents. Your most recent drawing or modification trumps anything that was previously categorized or drawn. A disappearing crop is more likely to occur when the area of the crop field is small and only represented by one or a few cells. If all of the crop cells get recategorized as something else (e.g. wildflower planting, apple, blueberry, etc.) then that crop will no longer appear on the yield graph. To fix this, delete the pollinator planting and redraw to avoid drawing over the crop pixel.
Has Pollination Mapper been tested?
- The model behind Pollination Mapper was first tested in 2009. The researchers who built the model compared the model’s predictions of wild bee abundance and pollen deposition against known wild bee abundance in Costa Rica, California and the Mid-Atlantic region of the United States (e.g. New Jersey and Pennsylvania). In 2013 the model was expanded to predict yield increases due to wild bee pollination and the predictions tested against known yield increases due to pollination. Most recently, in 2016, the model was used to predict bee abundance across the United States with input from expert opinion. These predictions were compared against the known bee abundance at 180 study sites in crop fields and semi-natural habitat across the US (e.g. in California, Iowa, South Dakota, Wisconsin, and Pennsylvania and New Jersey) and an additional 343 sites along roadways in 40 states to validate the model predictions.
- In 2017 the researchers who originally developed the model incorporated honey bees into the model and built Pollination Mapper to support specialty crop growers in making pollination management decisions. Part of this process included building the quantitative relationships between habitat enhancements and yield and honey bee stocking rates and yield. Pollination Mapper is currently being tested in the field in order to validate its predictions. Do you want to help test Pollination Mapper? If so, click here.
Can I use Pollination Mapper on my mobile device?
- Pollination Mapper is intended for use with desktop and tablet browsers and is designed to work on both iOS and Android tablets. On tablets, it is best used in landscape mode, where there is more space for the map and sidebar. It is not supported for use on smaller mobile devices.
Will there be updates to Pollination Mapper?
- Yes! However, updates are dependent on grant funds. We are actively pursuing additional funding to continue to improve the functionality of this tool.
I want to find out more about how to support crop pollination, where can I go?
- Visit the Integrated Crop Pollination resources for growers page and talk with your local extension agent and Natural Resources Conservation Service office. Additional resources can be found at the Xerces Society for Invertebrate Conservation pollinator conservation resource center.
—————————————————————————————————————–
Report a Problem
I found a problem with Pollination Mapper, who can I contact about it?
- Fill out this form to report the problem you found.
—————————————————————————————————————–
Request a Feature
I have an idea on how to improve Pollination Mapper, who can I contact about it?
- Fill out this form to submit your idea.
—————————————————————————————————————–
About
Pollination Mapper was created by members of the Integrated Crop Pollination Project. The tool’s development was led by Eric Lonsdorf (University of Minnesota), Taylor Ricketts (University of Vermont) and software developers at Azavea. Additional support was provided by Rufus Isaacs (Michigan State University), Xerces Society for Invertebrate Conservation Staff (Katharina Ullmann, Emily May, and Mace Vaughan), and members of the Integrated Crop Pollination research team and advisory board. We are grateful to the growers, extension staff, Xerces Society staff, and conservation specialists who tested early versions of this tool and provided suggestions on how to improve the tool. This project was funded by USDA-NIFA Specialty Crop Research Initiative Grant (#2012-51181-20105).