Contents
- Logging in
- Getting started
- Selecting a field or farm in the tool
- Correcting current land cover
- Creating new pollination management scenarios
- Comparing pollination management scenarios
- Saving, accessing, and sharing Pollination Mapper projects
- Additional questions, reporting bugs, and requesting features
To access and download this quick start guide as a pdf, click here.
—————————————————————————————————————–
Logging in
- Click on Login at the top-right of the home page.
- Create a username and password, then validate your account via email.
- Return to the site and log in.
- Your Pollination Mapper account will allow you to save and share projects that you create within the tool.

Create a Pollination Mapper account to save and share projects that you create within the tool.
—————————————————————————————————————–
Getting started
- On the home page, click the yellow Get Started button.
- This will take you to the Select Farm or Field of Interest page. Enter an address, town name, or other location in the search bar at the upper left of the page to zoom into your area of interest.
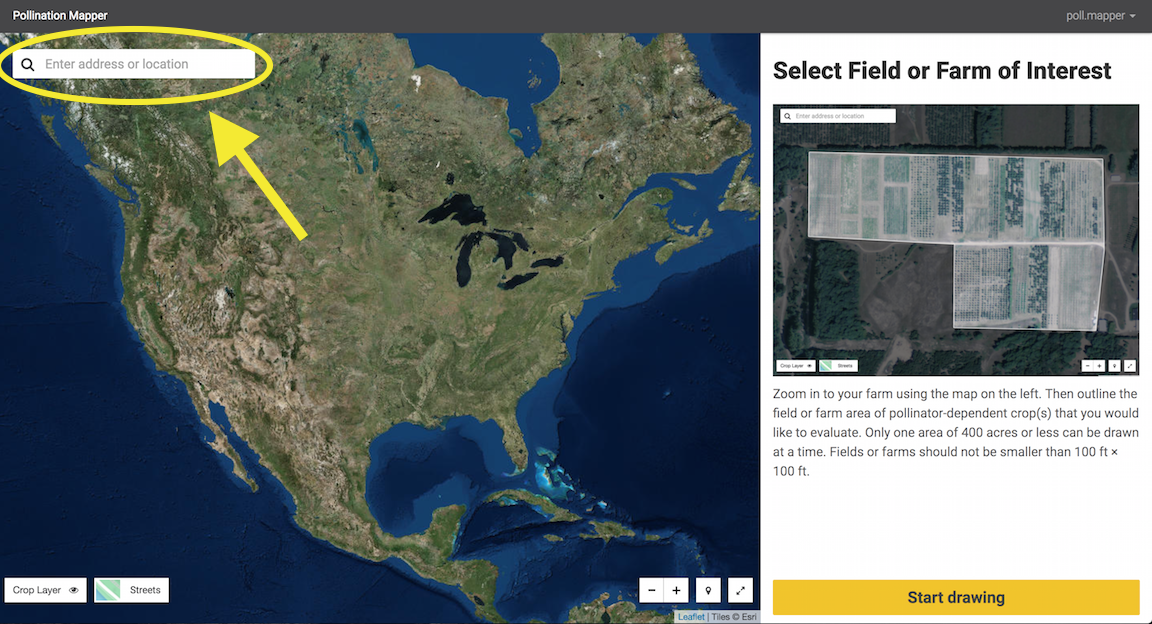
Enter an address, town name, or other location in the search bar to zoom into your area of interest.
—————————————————————————————————————–
Selecting a field or farm in the tool
- Click the Start Drawing button once you have zoomed in to your area of interest. Trace the borders of the farm or field where you are interested in developing new pollination management scenarios.
- The area should include an existing or planned field or block of a pollinator dependent crop supported by the Pollination Mapper tool (almonds, apples, blueberries, cherries, pumpkins, raspberries, or watermelons).
- The maximum size for a field or farm or interest in the tool is 400 acres. If your farm or field is larger than 400 acres, you will need to create multiple projects for different areas of the farm.
- The minimum field size that this tool can process is ~100 ft x ~100 ft.
- Click the first point or double click the last point of the shape to complete the drawing of the borders of your crop field or farm.
- Once you’ve selected an area, the tool will prompt you to confirm your drawing. If the polygon looks correct, click Confirm. If you’d like to redraw the selected area, click Redraw area.
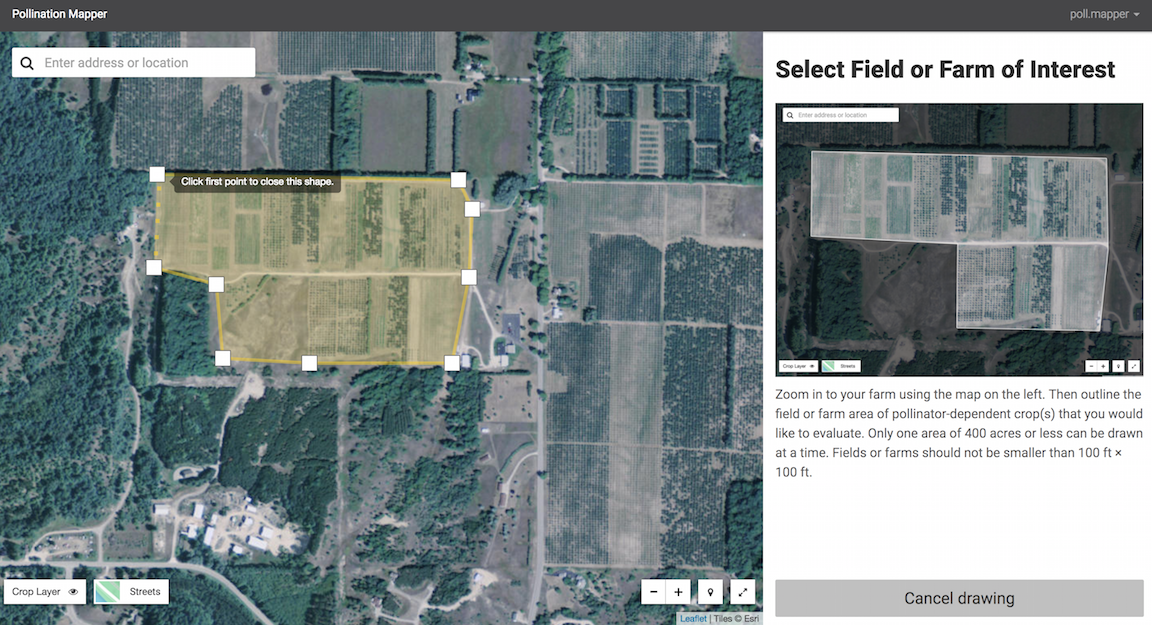
Trace the borders of the farm or field where you are interested in developing new pollination management scenarios.
—————————————————————————————————————–
Correcting current land cover
- The tool uses the USDA-NASS Cropland Data Layer for its base map of what crops are in your landscape. This is the best available national map of US cropland, but it has many inaccuracies at the local level.
- To see what crops are on the map for your selected area, toggle the Crop Layer button on and off at the lower left of the page. You can change the opacity of the Crop Layer with the sliding bar underneath the button.

Check the underlying base map for your area by toggling the Crop Layer on and off.
- The tool may state “No pollinator-dependent crops found in selected area” if the Crop Layer indicates that there are no supported crops in the selected area. If you have received this message in error (e.g., there are one or more fields of the supported crops in the selected area), you will need to correct the base map in the Current Crop Map tab using the Land Cover tool at the top left of the page.

Use the crop options in the Land Cover dropdown menu to correct the current crop map.
- Even if you do not receive this message, you will likely want to correct the base map for your farm or field or interest before creating new pollination management scenarios using the Land Cover tool.
- To correct the base crop map, add a field or block of a pollinator-dependent crop by clicking Land Cover and selecting the crop from the dropdown menu. Make sure you’re in the Current Crop Map tab.
- Draw the field or block on the map. The shape you draw will overwrite any Crop Layer cells it overlaps on the base map with the new crop and will carry over to any new scenarios you create.
- The Crops with Cover Crops options allow you to add a pollinator-dependent crop with intercropped flowering cover crops, such as clovers or mustards.
- Click on the drawn crop to see its size or to delete and redraw the crop.

Click on drawn crop areas to see the estimated size or to delete and redraw the block. Make sure the crops in the yield graph sidebar are correct before creating new scenarios.
—————————————————————————————————————–
Creating new pollination management scenarios
- Once you’ve corrected the base map in the Current Crop Map tab, you’re ready to create new pollination management scenarios!
- Click the New Scenario tab at top to create a new scenario, which will be compared to the baseline yields in your Current Crop Map.

Create a new management scenario by clicking the New Scenario tab.
- In the new scenario, you can choose from three different Pollinator Plantings to draw on the map or choose to change your stocking rate of managed honey bees in the Managed hives per acre box. If an error occurs while adjusting the number of hives per acre with the arrow keys, you can override the error by typing in a new number and hitting the enter key.
- Choose from three different pollinator planting options: a wildflower planting, a woody/wildflower mix consisting of pollinator-supporting forbs and trees/shrubs, and a woody planting of pollinator-supporting trees and shrubs.
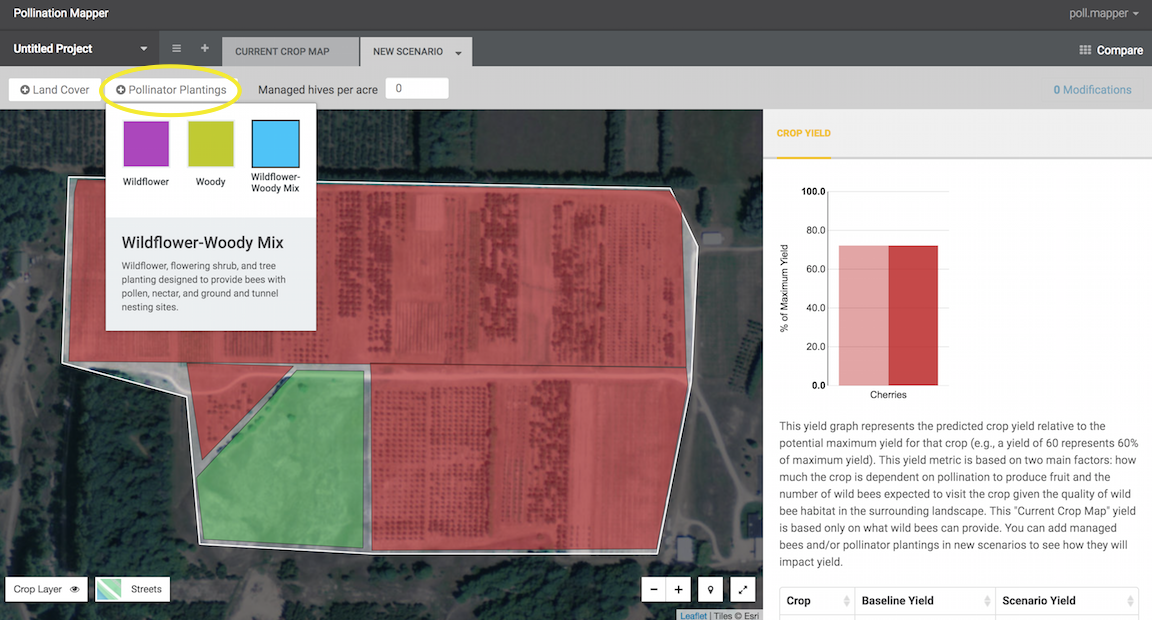
Use the Pollinator Plantings dropdown menu to select from three different pollinator planting options to draw into your new scenario.
-
- The minimum pollinator planting size that this tool can process is ~100ft x ~100ft. Click on the drawn pollinator planting to see the size of the planting or to delete the planting.
- Pollinator plantings can be added outside of the selected farm or field. However, the closer they are to your pollinator-dependent crop, the more likely they are to increase crop yields.
- New drawings will overwrite any previous drawings where the two overlap.
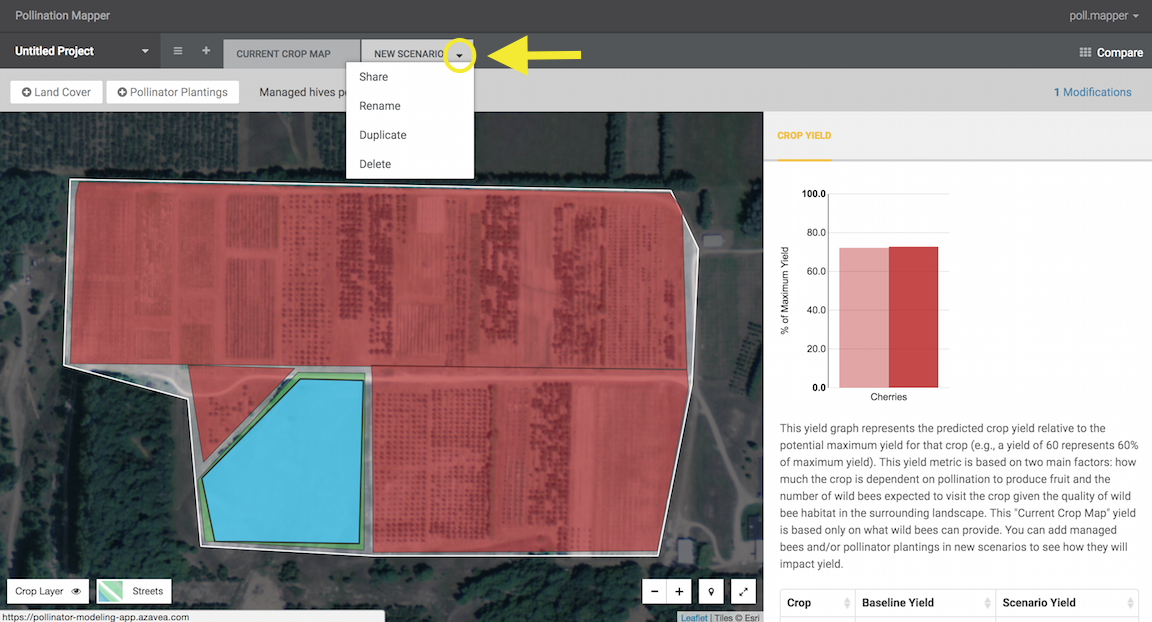
Use the dropdown menu to the right of the scenario tab to share, rename, duplicate, or delete the scenario.
- If you want to create different options for planting locations, or different combinations of managed honey bee hives and pollinator plantings in order to compare results, create additional new scenarios using the + button at the top of the page.
- You can duplicate a scenario by clicking on the dropdown menu at the top right of the scenario tab.
- Create names for different scenarios (e.g. “2 Hives per Acre,” “Woody Planting,” etc.) by clicking Rename in the dropdown menu at the top right of the scenario tab. Naming scenarios is helpful when comparing different scenarios in the next step.

Use the plus button to the left of the Current Crop Map tab to create additional new scenarios.

You can add a per-acre stocking rate of managed honey bee hives in new scenarios in this box.
- Check the list of changes you’ve made to each new scenario in the Modifications link at top right of the page. You can see the estimated area of drawn pollinator plantings and delete modifications from the scenario here.
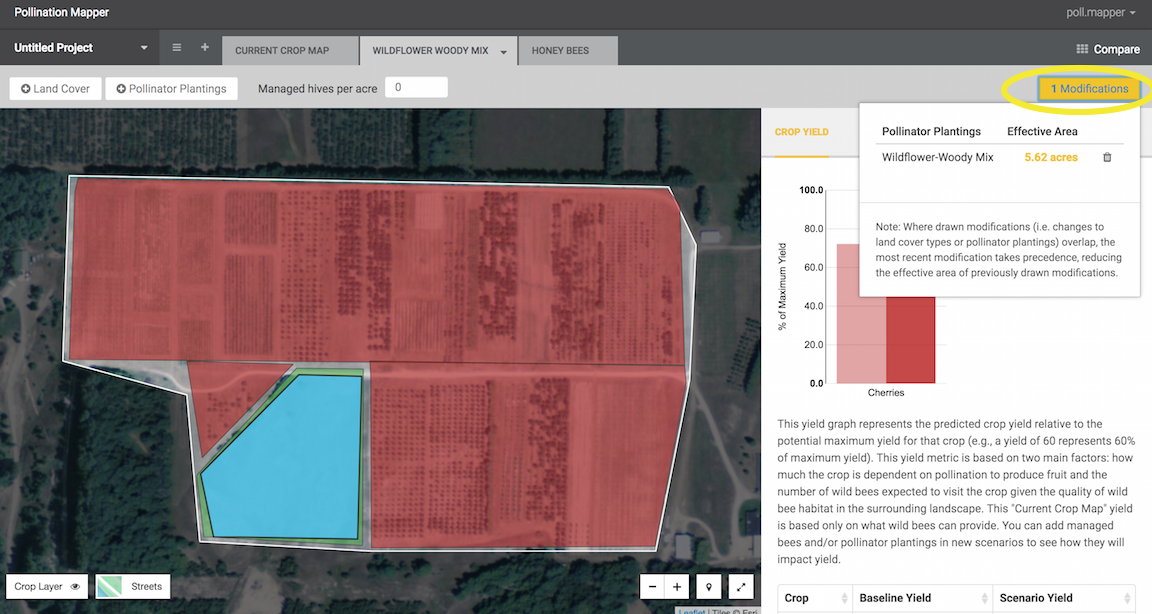
Check the list of changes you’ve made to each new scenario by clicking the Modifications button. You can see the estimated area of drawn pollinator plantings and delete modifications from the scenario here.
—————————————————————————————————————–
Comparing pollination management scenarios
- The Crop Yield box at the right of the page shows the relative yield (e.g. % of maximum yield) of any pollinator-dependent crops on your farm map.
- Relative yield represents the predicted crop yield relative to the potential maximum yield for that crop. This yield metric is based on two main factors: how much the crop is dependent on pollination to produce fruit, and the number of wild bees expected to visit the crop given the quality of wild bee habitat in the surrounding landscape.
- Yields would be closer to maximum in a landscape with abundant and excellent natural habitat for wild bees. Crops that are less dependent on pollinators will have yields closer to maximum than crops that are more dependent on pollinators given the same surrounding landscape.
- For each new scenario, you can compare relative yield of your different crops in the Crop Yield sidebar. The lighter bar represents the baseline relative yield for your Current Crop Map tab with no pollinator plantings or managed hives, compared to the darker bar representing the relative yield for your new management scenario.
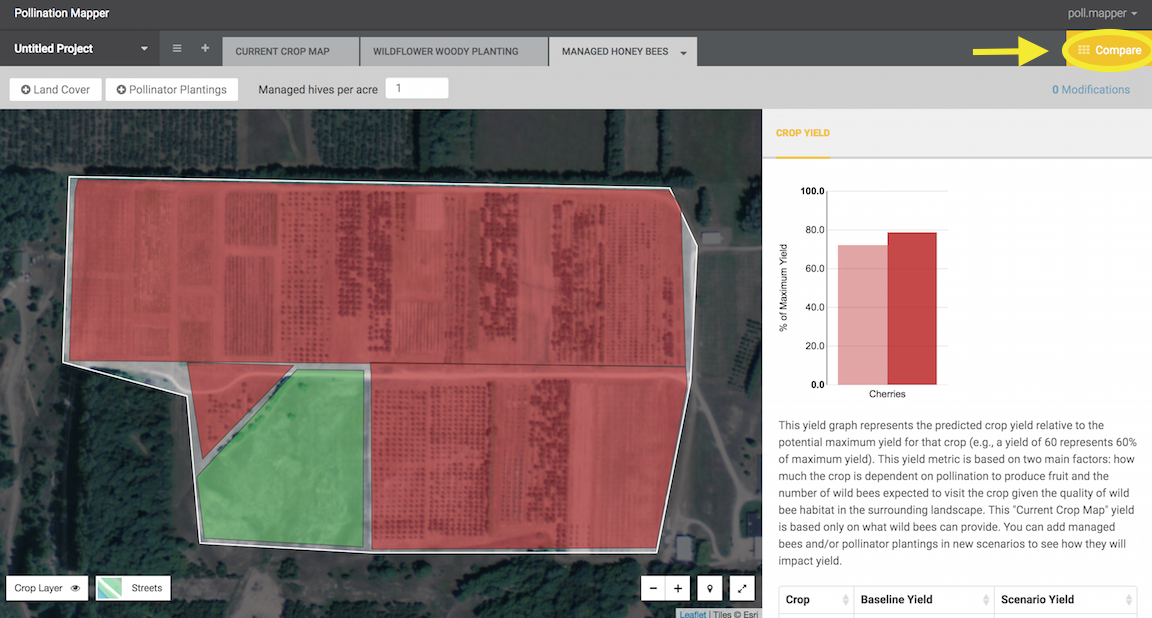
To compare multiple scenarios, click the Compare button.
- To compare multiple scenarios against your baseline yields, click Compare at the top right of the page. This will allow you to compare summaries of each of your new scenarios.
- Use the All Crops dropdown menu to toggle between comparing all crops or individual crops in your scenarios.
- See summaries of the estimated areas of any plantings added to your scenarios below the yield graphs.
- Click Go Back or use your browser back button to return to the main scenario creation page.
—————————————————————————————————————–
Saving, accessing, and sharing Pollination Mapper projects
- If you have logged in, any project you create will be automatically saved in your user account.
- Name your project by clicking on the dropdown menu at right of “Untitled Project” at the top right of the page and selecting Rename. This will help to keep your projects organized under your user account.

Name your project using the dropdown menu to the right of “Untitled Project” to help keep your projects organized.
- Share your project by selecting Share in the dropdown menu at left of your project name or sharing from your project folder in your user account.

Access saved projects in your user account by clicking “My Projects” in this dropdown menu.
- To access saved projects, click your username at the top left of the page, then select My Projects. This will take you to your folder of saved projects, where you can access, rename, and share existing projects. Projects will need to be made public in order to share a link by email.
- Any user accessing a public share link will be able to see and compare the scenarios you have created in the project, but will not be able to edit your scenarios.
—————————————————————————————————————–
Additional questions? See the FAQs for the tool here.
Want to report a bug? Submit this form to report bugs or problems with Pollination Mapper.
Have an idea on how to improve Pollination Mapper? Click here to share your idea with us.